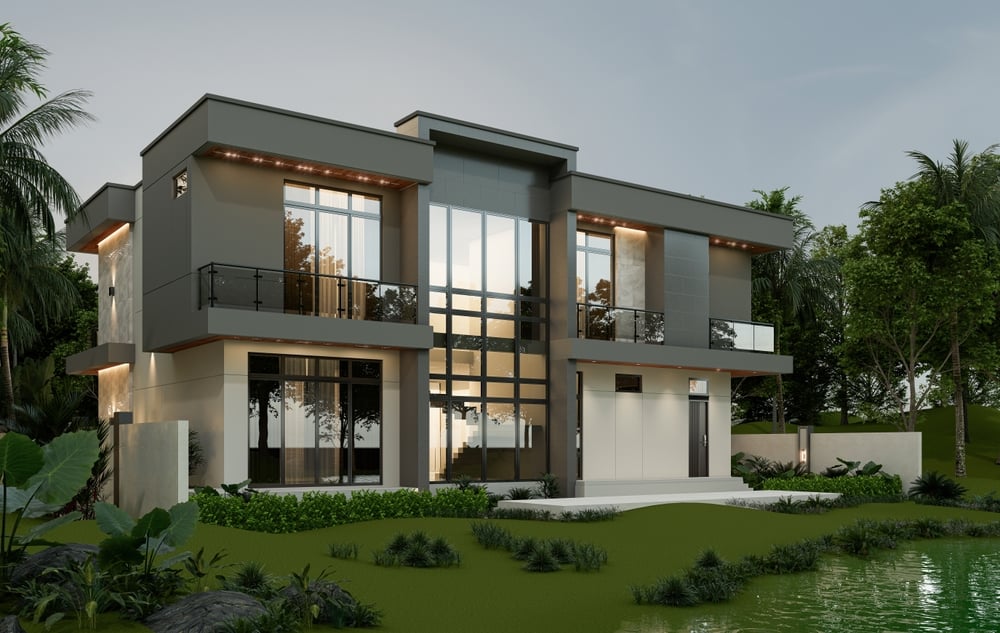

The $50,000 Mistake Nobody Saw Coming
True story. Mid-size residential developer in Texas. Approved plans. Permits secured. Construction underway. Then the client walkthrough happened.
“Wait. That window faces directly into the neighbor’s bathroom?”
Drawings showed it. Nobody visualized it. Redesign cost $47,000. Schedule slipped six weeks. Entirely preventable.
Real estate development swims in risk. Market risk. Construction risk. Financing risk. Regulatory risk. But one category gets consistently underestimated: design risk. The costly surprises hiding in plain sight within approved plans.
Where Design Risk Actually Lives
Every development project contains assumptions. Hundreds of them. Architects assume builders will interpret drawings correctly. Developers assume buyers will respond positively to design choices. Investors assume finished projects will match expectations.
Assumptions work fine until they don’t. Then they become change orders. Delays. Disappointed stakeholders. Lawsuits.
Professional 3d rendering services function as assumption-testing infrastructure. They transform abstract design intent into concrete visual reality – before concrete gets poured.
Benjamin Franklin’s old wisdom applies perfectly here: “An ounce of prevention is worth a pound of cure.” In development terms, a dollar spent on visualization saves ten to fifty dollars in construction corrections.
The Approval Gauntlet
Before breaking ground, most projects navigate extensive approval processes. Planning commissions. Design review boards. Community meetings. Historic preservation committees. Environmental agencies.
Each body has authority to delay or deny. Each brings different concerns. Each responds to different communication approaches.
What Approval Bodies Actually Want
Having sat through hundreds of planning meetings, certain patterns emerge:
- Planning commissions want context – how does this project fit the neighborhood?
- Design review boards want detail – materials, colors, architectural character
- Community groups want reassurance – traffic, shadows, view impacts addressed
- Historic committees want sensitivity – respect for existing architectural fabric
- Environmental agencies want compliance – demonstrated adherence to regulations
Technical drawings satisfy legal requirements. Visualization satisfies human decision-makers. Both matter. Only one truly persuades.
Speeding Through Approvals
Quantifying approval timeline impacts proves difficult – too many variables. But developers consistently report correlation between visualization quality and approval efficiency.
One Pacific Northwest developer tracked outcomes across twelve projects over four years. Projects with comprehensive visualization packages averaged 2.3 fewer revision requests and 47 days shorter approval timelines than those with standard documentation only.
Forty-seven days. In a market where carrying costs run thousands daily, those days translate directly to dollars.
Early Problem Detection
Here’s an uncomfortable truth. Most design problems are visible in drawings – technically. But human perception doesn’t work technically. It works visually.
A competent architect might spot problematic spatial relationships in floor plans. A developer focused on pro formas probably won’t. An investor reviewing multiple opportunities definitely won’t. A city council member seeing plans for the first time? No chance.
Visualization democratizes design understanding. Suddenly everyone sees what architects see. Problems surface in conference rooms rather than construction sites.
Common Issues Caught Through Visualization
Experience reveals certain problem categories appearing repeatedly:
Spatial proportion failures – rooms that meet dimensional requirements but feel cramped or awkward in three dimensions
Sightline conflicts – views into neighboring properties, overlooked utility equipment, unfortunate alignments
Material relationship problems – finishes that work individually but clash when combined
Lighting deficiencies – spaces that technically meet code but feel dark or uninviting
Circulation confusion – paths through spaces that seem logical in plan but disorient in practice
Scale disconnects – elements appropriately sized on paper but overwhelming or underwhelming in context
Each issue caught early costs hundreds or thousands to address. Caught late? Tens of thousands. Caught after occupancy? Lawsuits.
Budget Control Through Visual Validation
Construction budgets operate on estimates. Estimates derive from drawings. Drawings get interpreted.
That interpretation chain introduces variance. Contractors reading plans make assumptions about intent. Those assumptions affect pricing. When assumptions prove wrong, change orders follow.
Visualization reduces interpretive variance by clarifying intent visually. When contractors see exactly what’s expected – not approximately, exactly – pricing accuracy improves.
The Change Order Epidemic
Industry data paints sobering pictures. According to the Construction Industry Institute, design-related changes account for approximately 30% of all construction cost overruns. Average projects experience cost increases of 10-15% from change orders alone.
On a $50 million project, that’s $5-7.5 million in unplanned spending. A fraction of those overruns prevented justifies substantial visualization investment.
General George Patton, surprisingly relevant here, observed: “A good plan violently executed now is better than a perfect plan executed next week.” True in battle. In construction, though, validating the plan visually before execution prevents violence to budgets.
Investor Confidence and Risk Perception
Chapter 2 of any development finance textbook: investor returns correlate with perceived risk. Higher perceived risk demands higher returns. Lower perceived risk enables better terms.
Visualization directly impacts risk perception. When investors see exactly what their capital will create – in photorealistic detail – uncertainty decreases. Not eliminated. Decreased.
That decrease translates to:
- Lower required returns on equity investments
- More favorable debt terms from lenders
- Reduced contingency requirements in budgets
- Faster capital raising timelines
- Broader investor pool access
Each factor improves project economics. Combined, they can shift marginal projects toward viability.
Stakeholder Alignment
Development projects involve too many stakeholders. Owners. Architects. Engineers. Contractors. Investors. Lenders. Regulators. Future occupants. Neighbors. Politicians.
Each stakeholder interprets project documentation through their own lens. Misalignment between interpretations creates conflict. Conflict creates delays. Delays create costs.
Visualization provides common reference points. When discussing “the lobby,” everyone sees the same lobby. When debating “the facade treatment,” everyone evaluates identical imagery. Conversations become productive rather than confused.
The Meeting Efficiency Factor
Anecdotal but consistent: development meetings with strong visualization run shorter and conclude more decisively than those without.
Why? Less time spent explaining. Less confusion requiring clarification. Fewer tangents from misunderstanding. More rapid convergence toward decisions.
For senior executives billing time at hundreds hourly, meeting efficiency has real value. For projects with dozens of stakeholders across hundreds of meetings, that value compounds substantially.
Pre-Sale Risk Mitigation
Unsold inventory represents existential risk for developers. Carrying costs accumulate. Lender patience expires. Profit margins erode. Partners grow restless.
Strong pre-sale performance mitigates this risk. And pre-sales require selling something that doesn’t exist yet.
Visualization enables pre-sales by:
- Creating marketing materials before construction completion
- Providing buyer confidence in design quality and finish levels
- Enabling virtual tours for distant buyers unable to visit
- Supporting pricing justification through perceived value
- Differentiating from competitors relying on basic drawings
Architect Philip Johnson stated: “Architecture is the art of how to waste space.” In development economics, architecture is the art of how to sell space. Visualization makes that selling possible before space exists.
Legal Documentation Value
Disputes happen. Despite best intentions, developers and buyers sometimes disagree about what was promised versus delivered.
Visualization created during marketing serves as documentary evidence of representations made. When specifications match rendered imagery, claims of misrepresentation become difficult to sustain.
This documentation value cuts both ways. Developers should ensure visualizations accurately reflect specifications. Exaggerated renders create legal liability. Accurate ones provide protection.
Risk Categories Addressed
Summarizing visualization’s risk reduction impact across categories:
Design Risk – problems detected early when correction costs remain low
Approval Risk – clearer communication accelerating regulatory processes
Budget Risk – reduced interpretive variance limiting change orders
Sales Risk – enhanced marketing enabling stronger pre-sale performance
Stakeholder Risk – improved alignment reducing conflict and delay
Legal Risk – documentation of representations made to buyers
Capital Risk – lower perceived uncertainty improving financing terms
No single risk eliminated entirely. Each reduced meaningfully. Cumulative impact: substantial.
The Calculation That Matters
Development is ultimately mathematics. Returns must exceed costs sufficiently to justify risk undertaken.
Visualization investment – whether $20,000 or $200,000 depending on project scale – should be evaluated against risk reduction value. Not marketing value alone. Total risk reduction across all categories.
That calculation almost always favors visualization. The question isn’t whether to invest. It’s how much, deployed when, focused where.
As management theorist Peter Drucker noted: “The greatest danger in times of turbulence is not the turbulence – it is to act with yesterday’s logic.” Yesterday’s logic minimized visualization investment. Today’s logic recognizes its central role in risk management.
Development projects face enough uncontrollable risks. Market shifts. Interest rate changes. Supply chain disruptions. Political uncertainty.
Why accept controllable risks? Why leave design validation to imagination rather than visualization? Why discover problems during construction rather than during planning?
The developers consistently delivering successful projects share one characteristic: they treat visualization not as marketing expense but as risk management infrastructure. That perspective shift changes everything.